SEWING AS A DESIGN PRACTICE: DATA Visualizations (2021-current)
This collection of data visualizations communicate patterns in public data related to parenthood and reproductive rights in the United States. The use of embroidery techniques is a deliberate choice in actively resisting the use of technology and pushing against capitalist and patriarchal systems in design production. The sewing practice embraces craft, imperfection, slowness, and tactility in the process of making. These qualities make the data more meaningful, accessible, and memorable to a viewer, something that is often lost in the oversaturated landscape of digital data visualizations..

Out of State Abortion Care Patients > 10% Increase from 2020-2023
The Monthly Abortion Provision Study, managed by the Guttmacher Institute, compares data from 2023 to 2020 retrieved from the most recent Abortion Provider Care Census. Recent findings in the study show that abortion bans and restrictions led to an increase in patients forced to travel across state lines for needed care. This polar area chart is visualizing the ten states with more than a 10% increase in travel across state lines for abortion care, from 2020 to 2023.

Workforce Decline During the Pandemic 2/20-1/21
Statistics from a published Gallup Survey that compared the participation rates of women and men with and without children in the US Labor force during the first year of the pandemic (February 2020-January 2021) was used in this piece. This data revealed that the number of women with children who left the workforce was much greater than men with children that left the workforce, as well as men and women with no children.
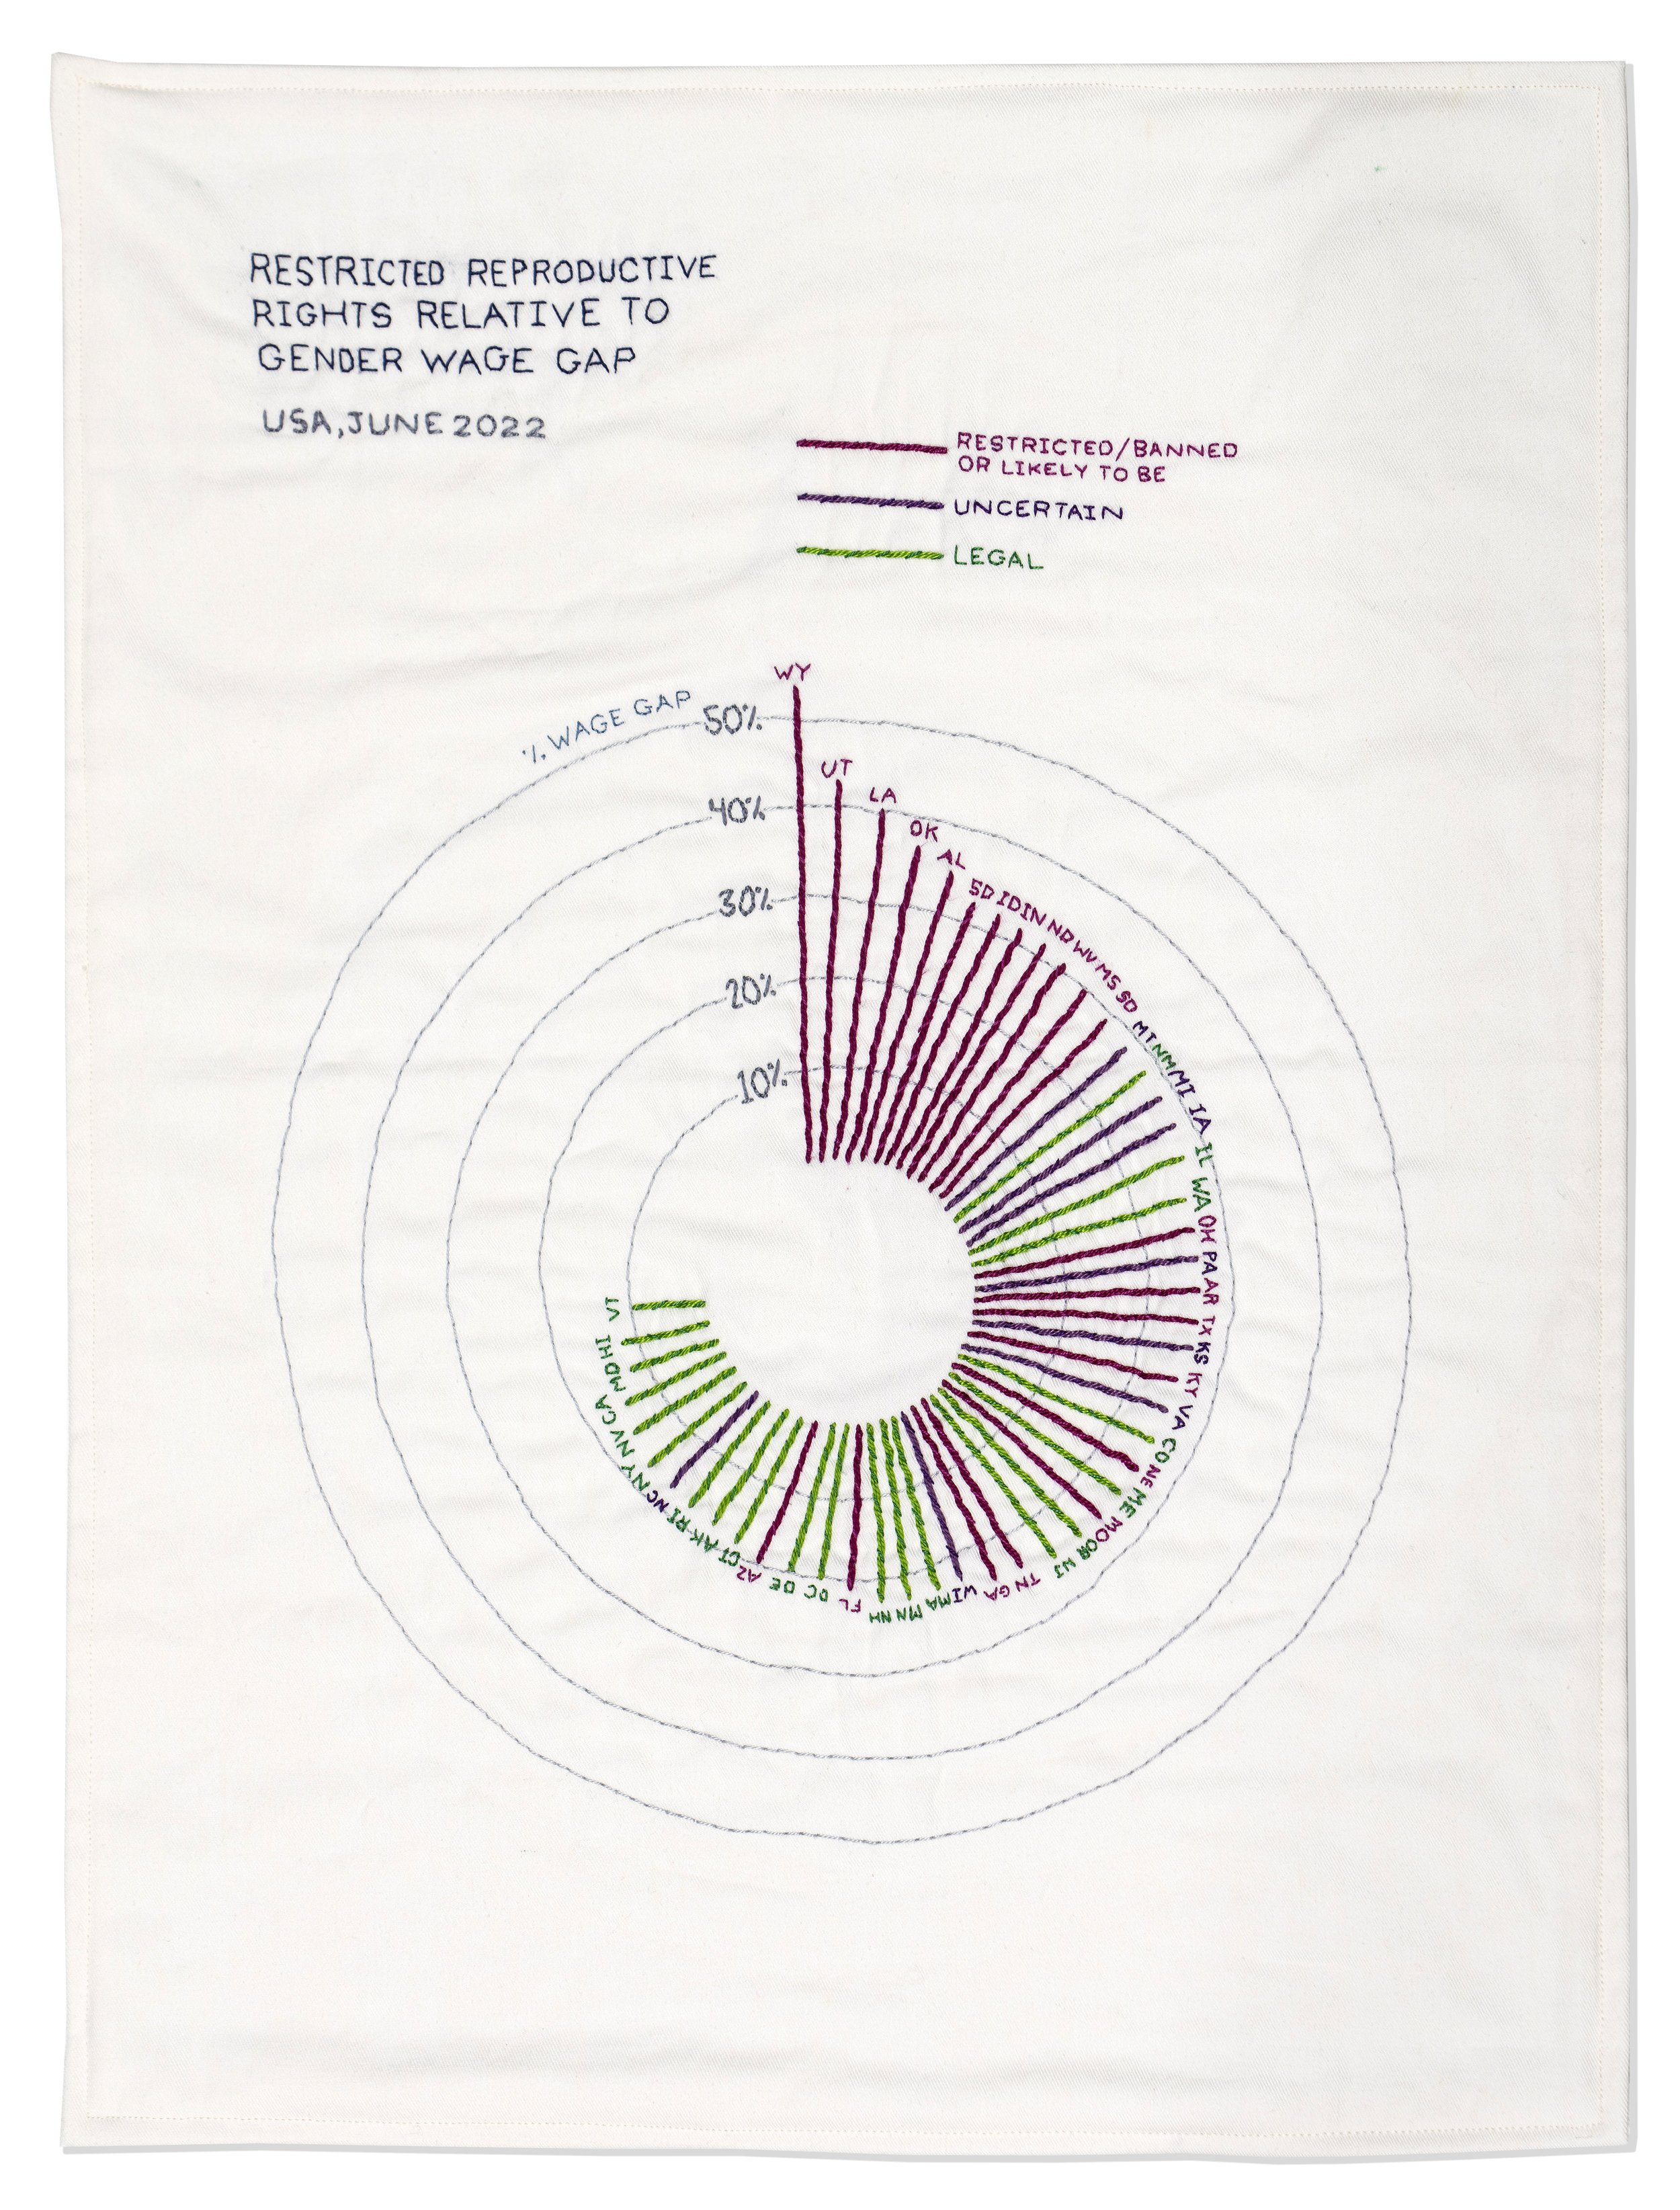
Restricted Reproductive Rights
This data visualization was made in response to the Supreme Court’s decision to overturn Roe vs. Wade in June 2022. Each state’s reproductive rights’ status (as of June 2022) is compared to the percentage of gender wage gap in each state. Data from the U.S. Census Bureau and the Guttmacher Institute was used in the creation of this visualization that uses a modified form of the radar chart as the structure for the data.
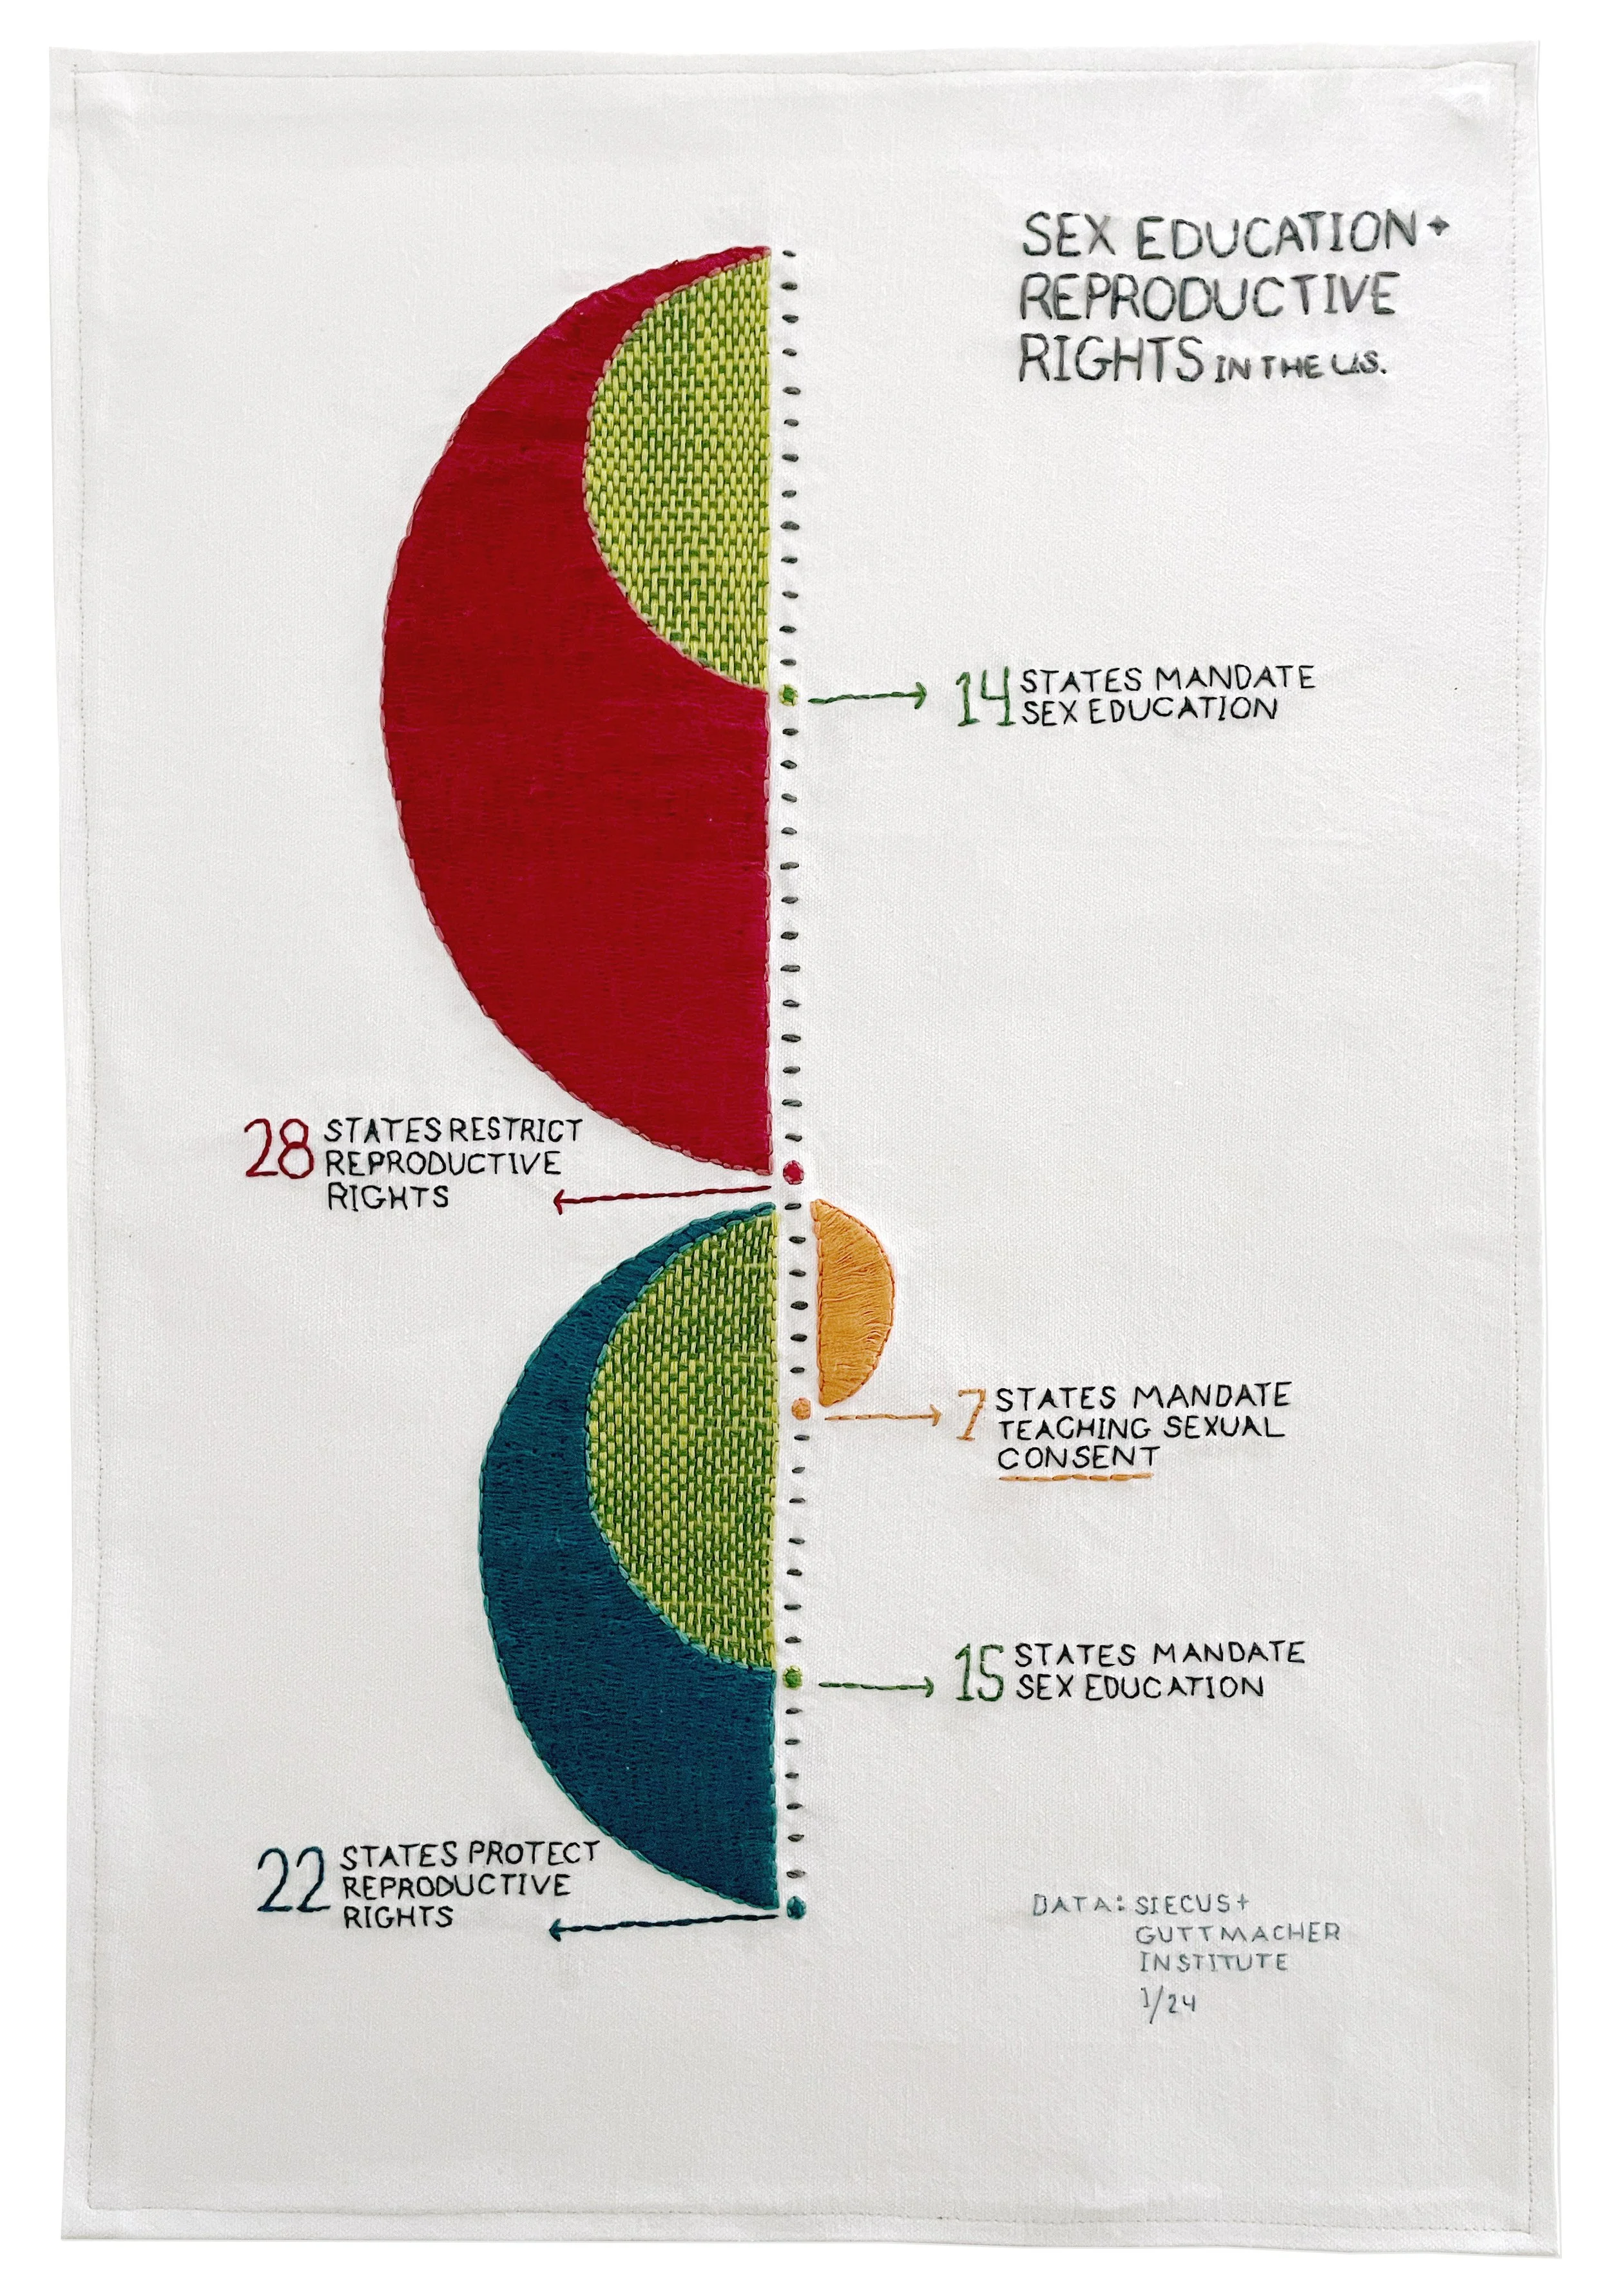
Sex Education + Reproductive Rights
This hand-stitched proportional area chart is in response to the many restrictions put on reproductive freedoms across the US and how sex education factors in. Sex education is determined at the state-level and isn't always mandated, nor does it cover conversations about sexual consent. Data for this visualization was retrieved from SIECUS and Guttmacher Institute.
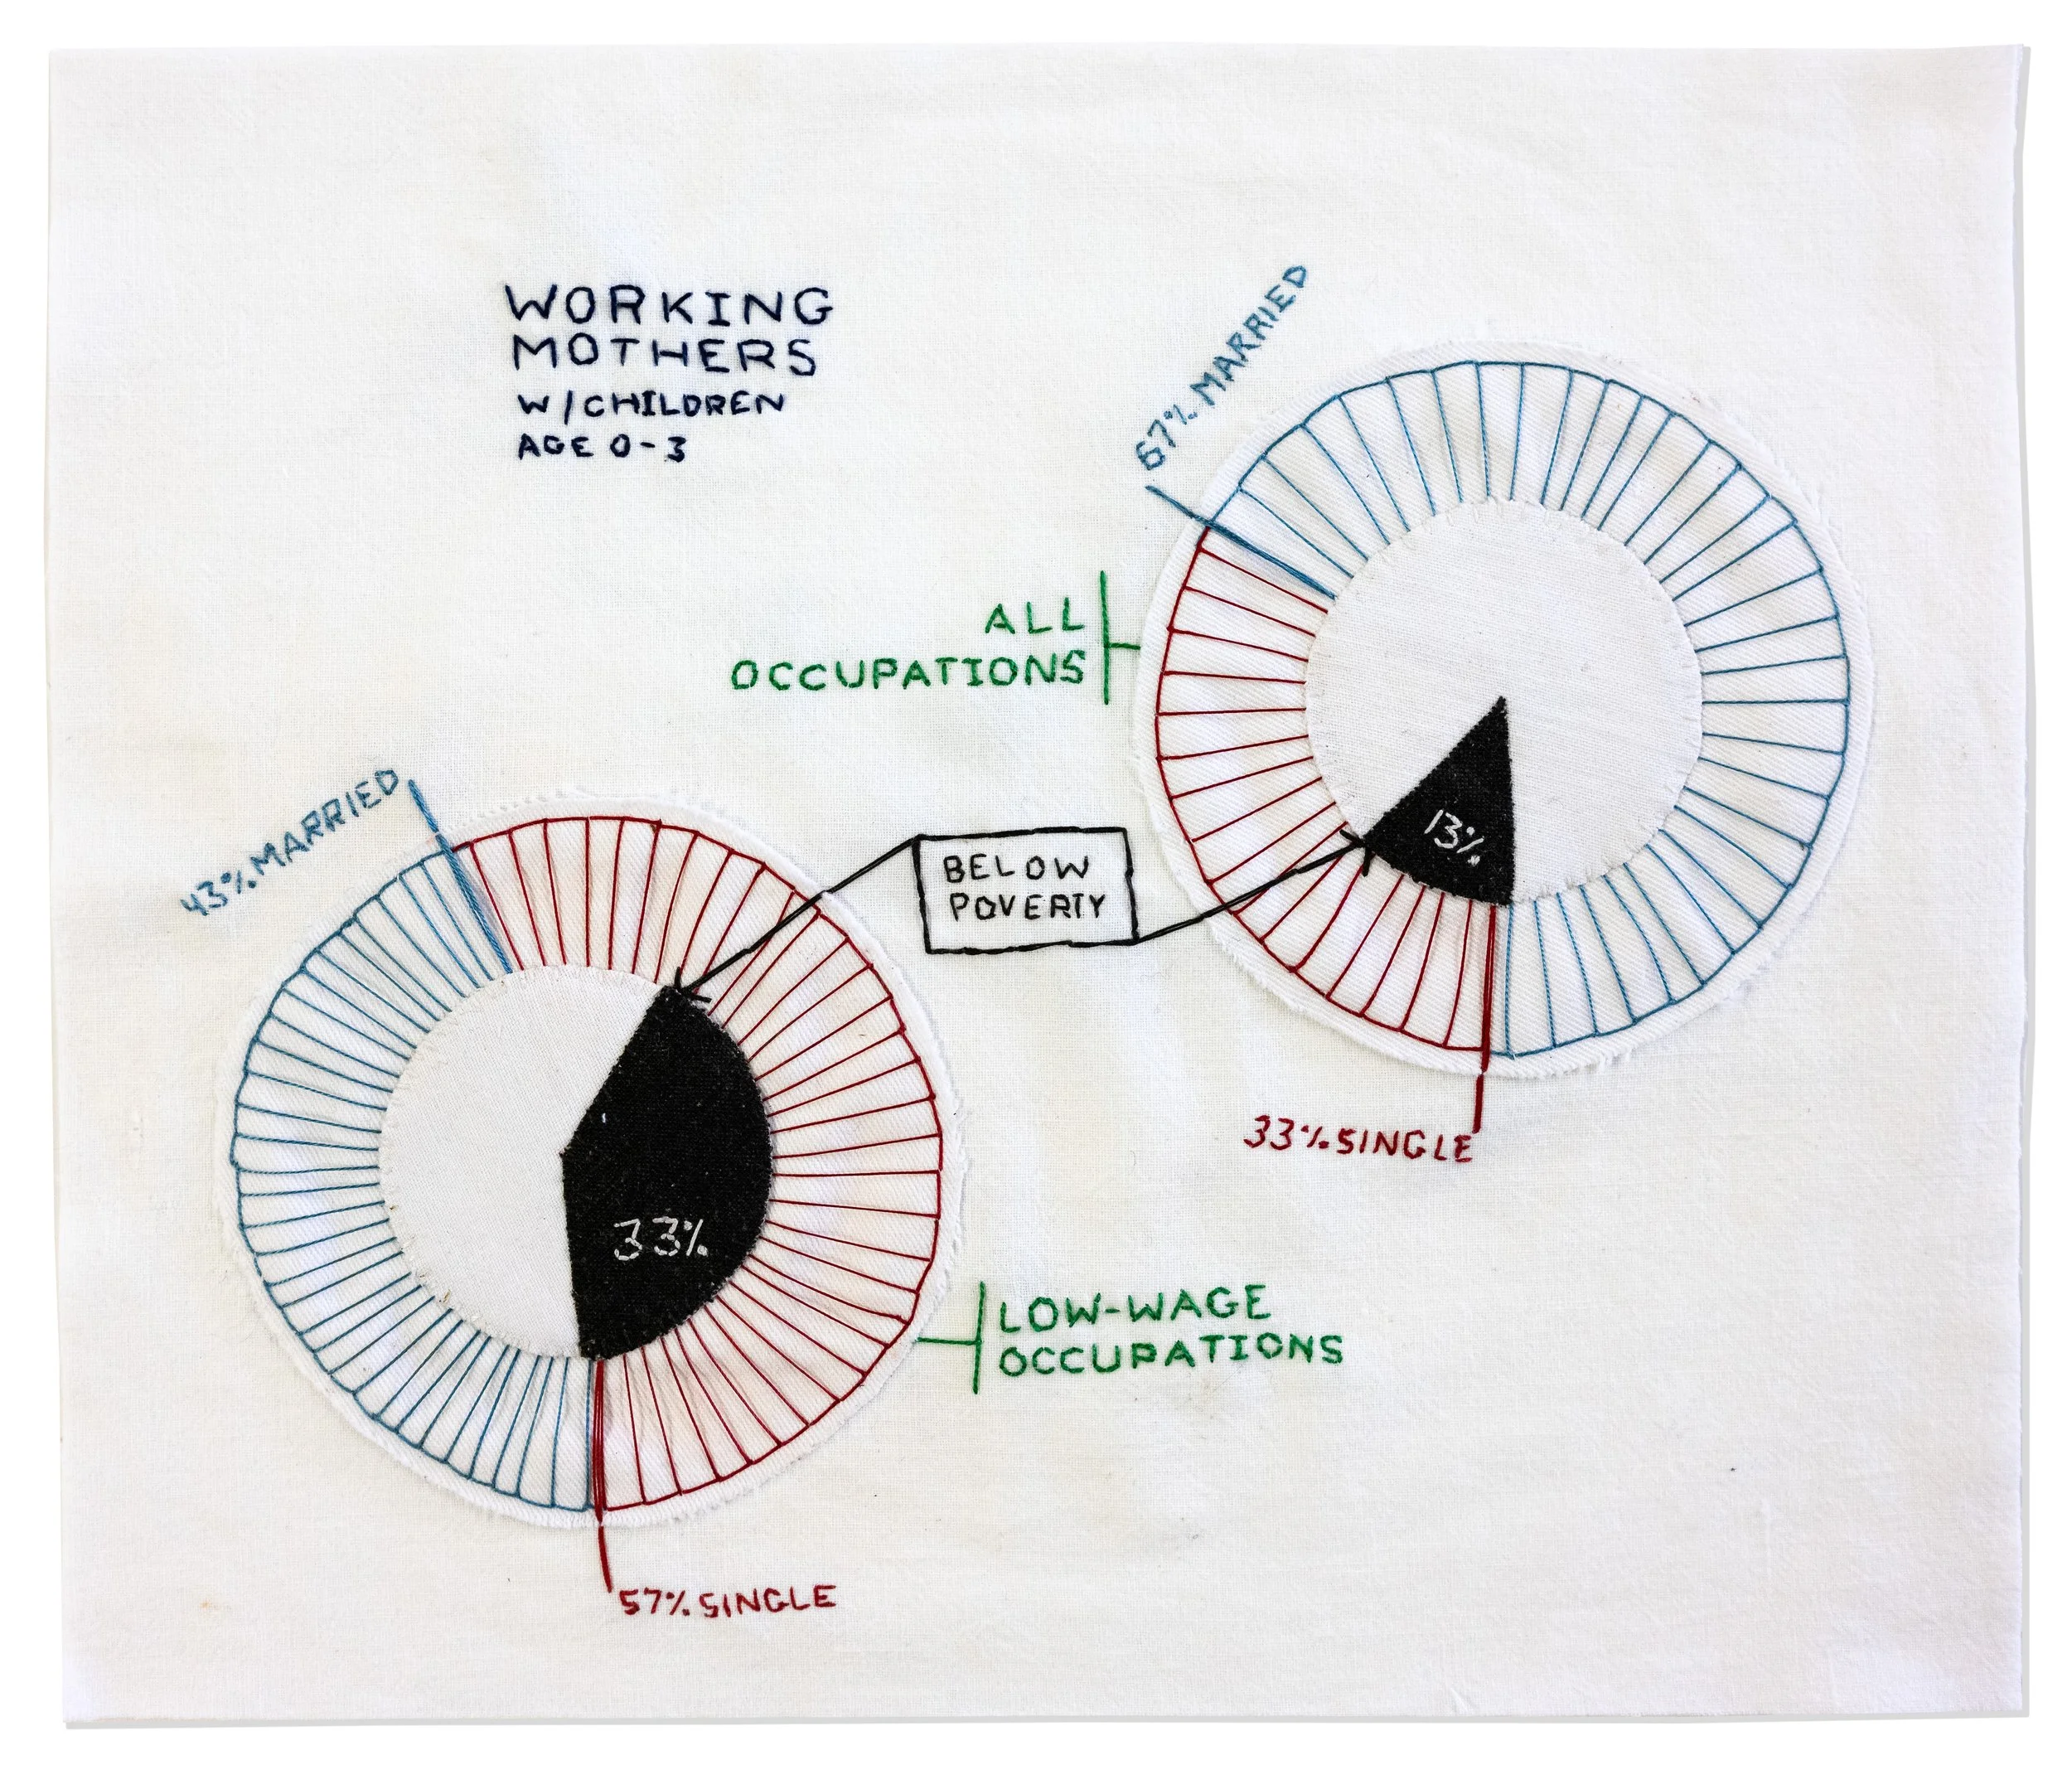
Working Mothers with Children ages 0-3
This piece reveals the number of women (with children under the age of 3) working across all occupations compared to those in low-wage (minimum wage) occupations, their marital status and who falls below the poverty line. This shows that more than half of working mothers with young children in low-wage jobs don’t have spousal support and 33% of them fall below the poverty line. The data is retrieved from the Bureau of Labor Statistics and the National Women’s Law Center.
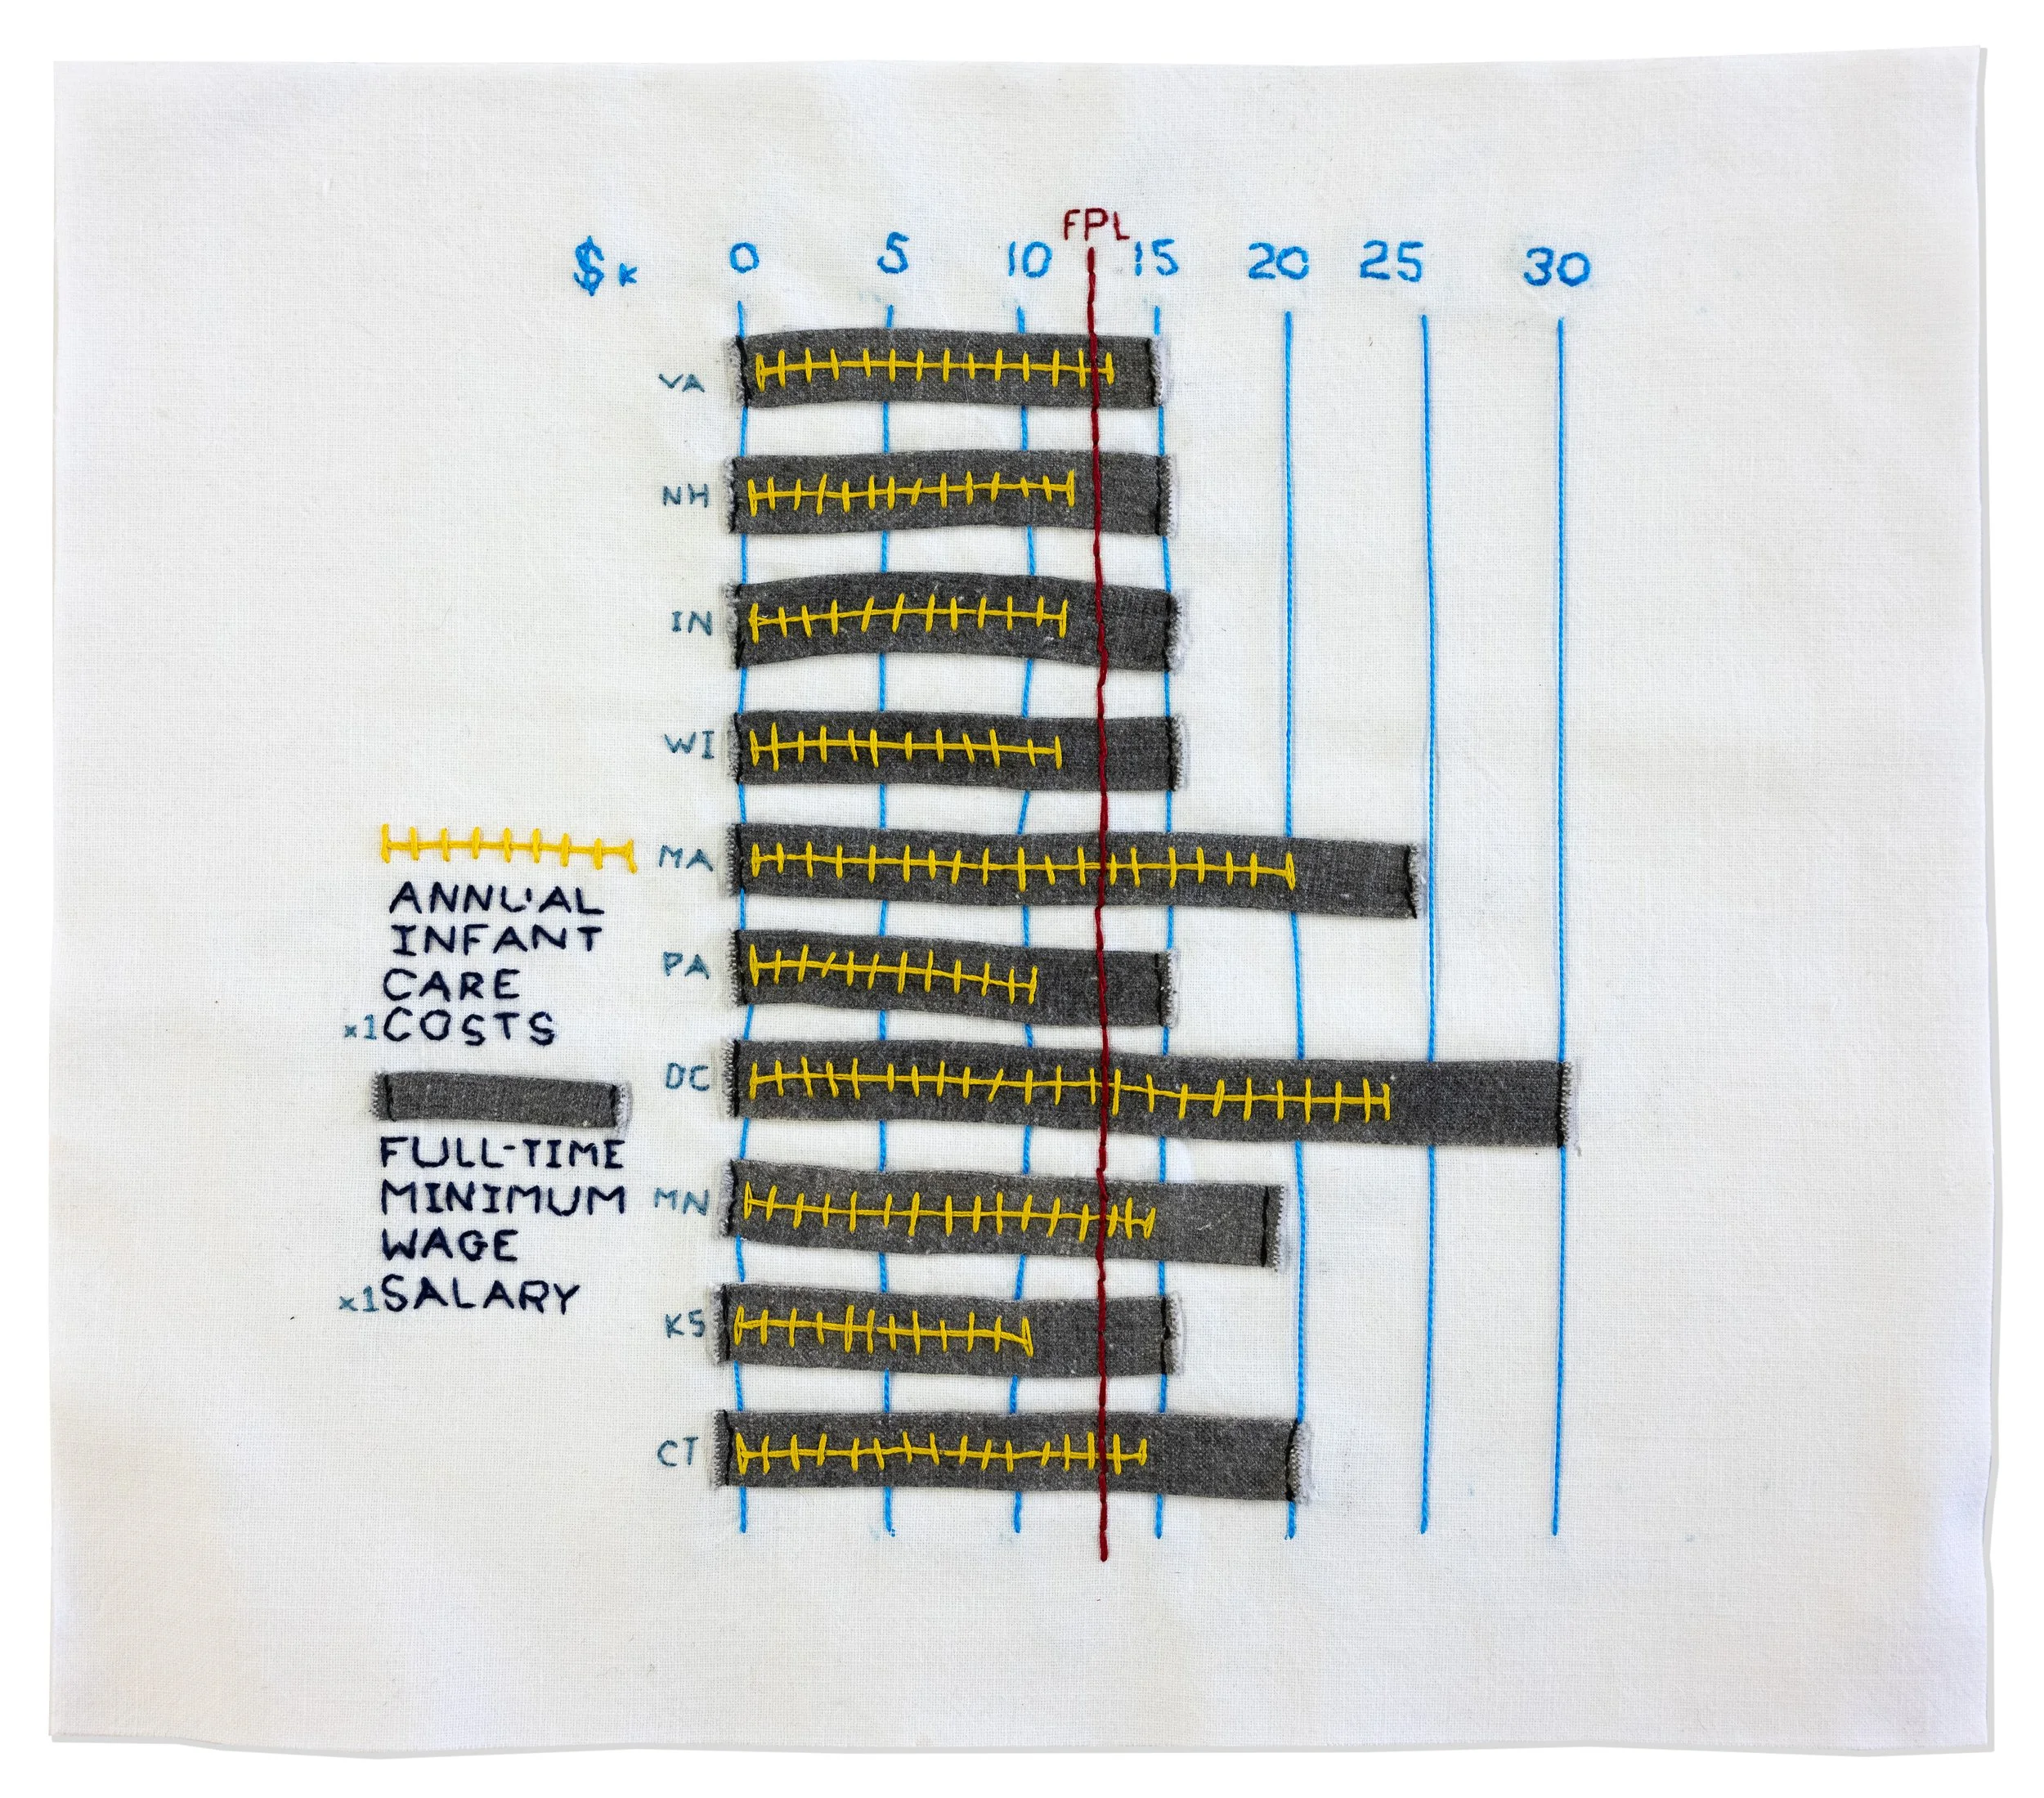
Annual Infant Care Costs compared to Full-time Minimum Wage Salary and the Federal Poverty Line (FPL) in the 10 most “unaffordable” states
This data visualization uses a form of a layered bar chart. The visualization shows the inequity of both childcare costs and the minimum wage in states where someone working full-time at minimum wage can hardly make enough to pay for one child below the age of 3 to be in daycare. This data is retrieved from the Bureau of Labor Statistics and the Economic Policy Institute.
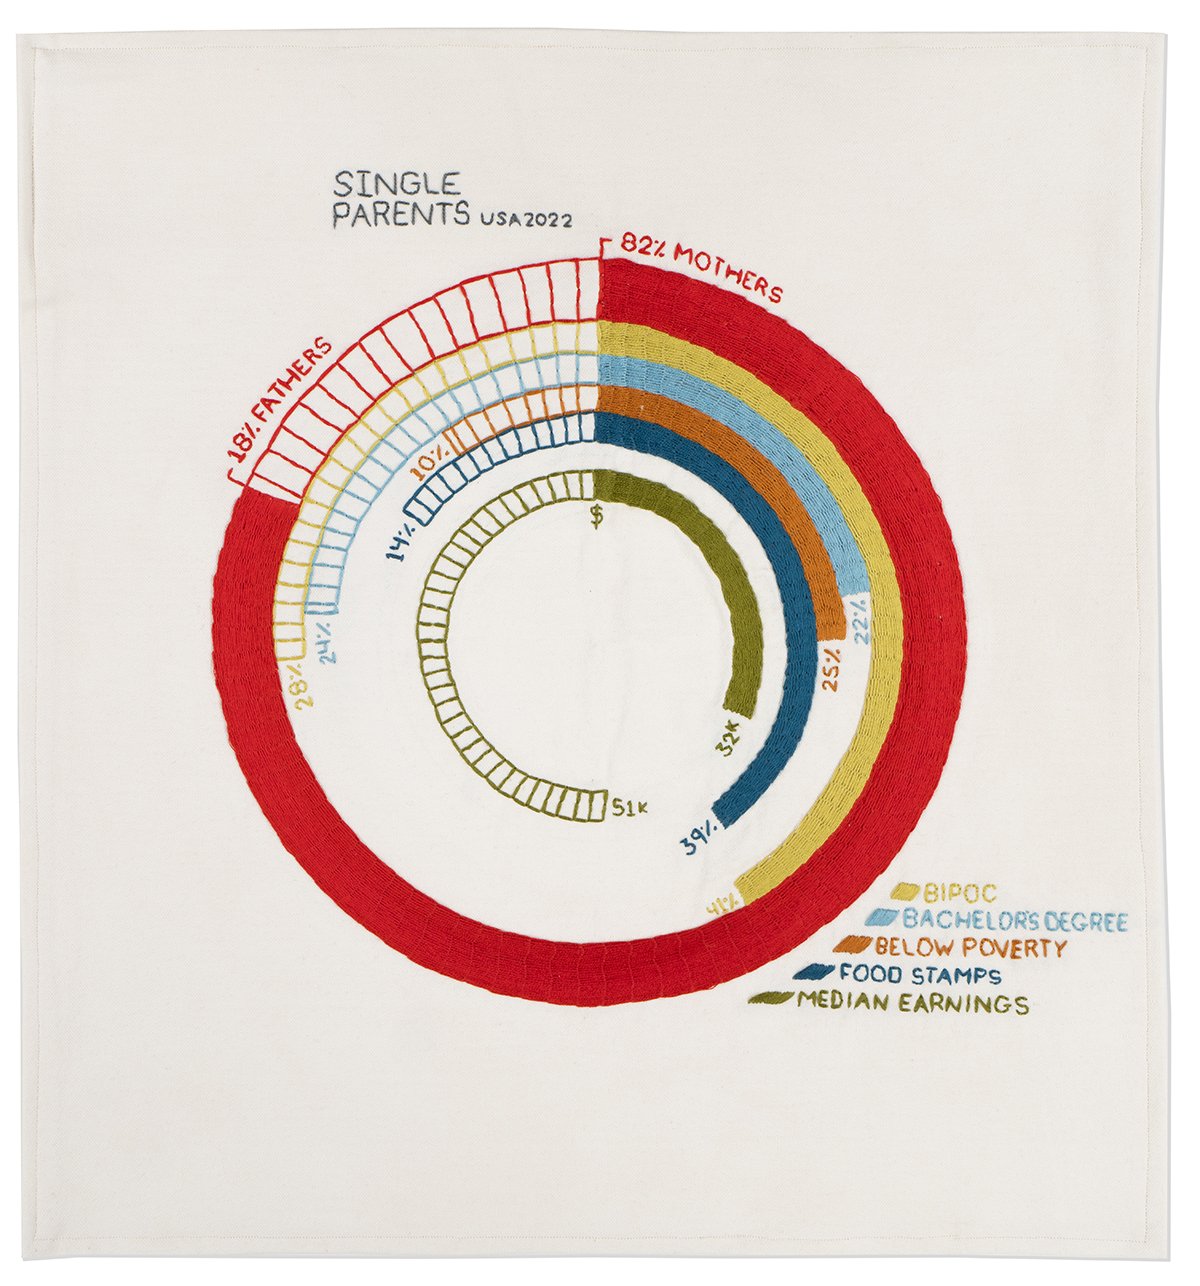
Single Parents, USA 2022
The US Census Bureau published a report on “America’s Families and Living Arrangements: 2022”. This visualization highlights categories from the report of all single parents and compares the percentages of single parents of color, those with bachelor degrees or higher, those in the labor force that are below poverty level, those receiving food stamps, and the median earnings of single mothers compared to single fathers. The radial bar chart reveals the discrepancies and similarities across all single parents in 2022.